Lots of Data
So much data everywhere. So much noise! How do I find what I’m looking for? How can I collect what I need quickly and efficiently? Most importantly, how can I make sense of it all?
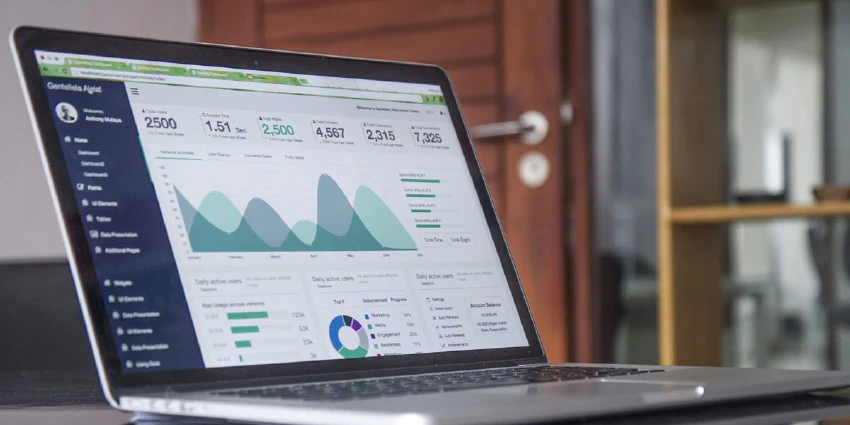
Many of my projects either require data, generate data, or both, and I need to develop more efficient ways to collect, store, and process it. And, of course, I need to make the data visual so that it becomes valuable and actionable information for us mere humans.
Several of my projects are relatively simple single-purpose bots that only collect data and then store it somewhere for further processing by other systems or applications.
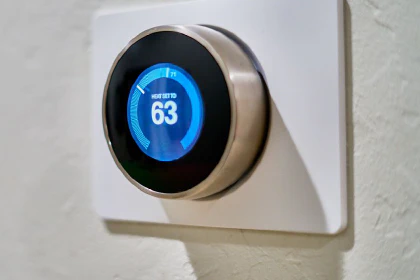
I collect some data from online sources and then combine it with my data. For example, I can get historical weather data and forecasts from a 3rd party such as OpenWeather and then combine it with data from my environment sensors.
Most of these projects are still in the early design or implementation phase, and I’m still learning a lot, especially about collecting streaming sensor data. This data should be stored in some time-series database, which, of course, is a whole project by itself.
So yes, I still have a long way to go on this one 🤓


